


out
Kenya Yaki Straight Lace Front – Long Lengths
Description
Afrodite’s Kenya Yaki Straight Lace Front, with realistic hairlines and the added comfort of adjustable straps at the nape.
This winning combination of lace and adjustable strap is available in many colours, lengths and textures – they’re fun, easy to wear and ideal for lace wig newbies.• 100% Remy human hair.
- Yaki Straight (afro relaxed) texture.
- 3″ lace front.
- Baby Hairs.
- Light brown French lace.
- Application & care instructions included.
- Lace fronts are secured using wig tape or adhesive.
Features of Kenya Yaki Straight Lace Front
- The yaki texture resembles relaxed afro hair.
- Can be worn straight or curly
- Creates fuller afro relaxed styles.
- Beautiful seamless lace front with baby hairs.
An adjustable strap at the back making it easy to fit and wear.
Pretty storage box to store your wigs & extensions when not in use.
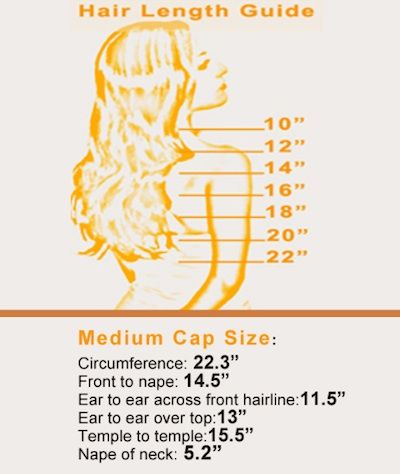
SEE ALL IMAGES INCLUDING HAIR COLOURS & HAIR LENGTH GUIDE
Model is wearing 20″ Yaki Straight, Colour 1B but also have
Colour 1 – Jet black Colour 1B – Off black
Colour 2 – Darkest brown Colour 4 – Light brown
Other long lengths available 20″, 22, 24″ & 26″
Medium cap – see size guide for further details.
Additional information
| Hair Length |
|---|
There are no question found.
Related products


drover sointeru
Absolutely indited content, Really enjoyed reading.https://www.droversointeru.com
Dana
The Heart Of The Internet The Heart Of The Internet --- Anavar Only Cycle In the realm of bodybuilding and fitness, an anavar-only cycle has become increasingly popular among athletes seeking lean muscle gains while minimizing water retention. The approach involves exclusively using the anabolic steroid oxandrolone (commonly known as <a href="https://www.valley.md/anavar-dosage-for-men">anavar dosage for female</a>), often combined with strategic dietary and training adjustments to maximize results. Key Components Dosage Regimen Most practitioners begin with a low dose, typically 20 mg per day for the first week, gradually increasing to 40–60 mg over subsequent weeks. This gradual escalation helps mitigate potential side effects such as androgenic irritation or liver strain. Training Focus Resistance training remains central—heavy compound lifts paired with high‑intensity interval cardio promote fat loss and lean muscle gain. The steroid’s mild anabolic effect is amplified by progressive overload and adequate protein intake (1.6–2.2 g/kg body weight). Nutritional Support Balanced macronutrients are essential: a slight caloric deficit (~500 kcal below maintenance) fuels fat loss while preserving muscle mass. Micronutrients like vitamin D, magnesium, and zinc help support hormonal equilibrium. Monitoring & Safety Routine blood panels (lipid profile, liver enzymes, hormone levels) track potential side‑effects. If any values deviate beyond healthy ranges, dose adjustments or discontinuation are warranted. Duration & Withdrawal A typical cycle lasts 6–8 weeks, after which a tapering period of 1–2 weeks helps mitigate withdrawal symptoms (fatigue, mood swings). Adequate sleep and a balanced diet support recovery. Practical Example Consider a client who wants to: Lose weight: Focus on calorie deficit, strength training. Build muscle: Increase protein intake (1.6 g/kg body weight), incorporate progressive overload. Improve energy levels: Ensure sufficient sleep, manage stress, and monitor hormone markers. By integrating these strategies with the supplement protocol above, you can address both performance and health concerns holistically. 5. Final Thoughts Balance is key: Supplements should complement a sound diet and training plan, not replace them. Listen to your body: Adjust doses based on how you feel; if you notice adverse effects, reduce or discontinue the supplement in question. Stay informed: Keep up with new research—nutrition science evolves rapidly, and what’s considered optimal today may change tomorrow. With careful planning, evidence‑backed choices, and a willingness to adapt, you can use supplements not just as performance enhancers but as tools for long‑term health and resilience. Happy training!
The Heart Of The Internet
—
Anavar Only Cycle
In the realm of bodybuilding and fitness, an anavar-only
cycle has become increasingly popular among
athletes seeking lean muscle gains while minimizing water retention. The approach involves exclusively using the anabolic steroid oxandrolone (commonly known as anavar dosage for female), often combined with strategic dietary
and training adjustments to maximize results.
Key Components
Dosage Regimen
Most practitioners begin with a low dose, typically 20 mg per day for the first week, gradually increasing to 40–60 mg over subsequent weeks.
This gradual escalation helps mitigate potential side effects such as androgenic irritation or liver strain.
Training Focus
Resistance training remains central—heavy compound lifts paired
with high‑intensity interval cardio promote
fat loss and lean muscle gain. The steroid’s mild anabolic effect is amplified by progressive overload and adequate
protein intake (1.6–2.2 g/kg body weight).
Nutritional Support
Balanced macronutrients are essential: a slight caloric deficit
(~500 kcal below maintenance) fuels fat loss while preserving muscle mass.
Micronutrients like vitamin D, magnesium, and zinc help support hormonal equilibrium.
Monitoring & Safety
Routine blood panels (lipid profile, liver enzymes, hormone levels)
track potential side‑effects. If any values deviate beyond healthy ranges, dose adjustments or discontinuation are warranted.
Duration & Withdrawal
A typical cycle lasts 6–8 weeks, after which a tapering
period of 1–2 weeks helps mitigate withdrawal symptoms (fatigue, mood swings).
Adequate sleep and a balanced diet support recovery.
Practical Example
Consider a client who wants to:
Lose weight: Focus on calorie deficit, strength training.
Build muscle: Increase protein intake (1.6 g/kg body weight), incorporate progressive overload.
Improve energy levels: Ensure sufficient sleep, manage stress, and monitor hormone markers.
By integrating these strategies with the supplement protocol above, you can address
both performance and health concerns holistically.
5. Final Thoughts
Balance is key: Supplements should complement a sound diet and training plan, not replace them.
Listen to your body: Adjust doses based on how you feel; if you
notice adverse effects, reduce or discontinue the supplement in question.
Stay informed: Keep up with new research—nutrition science evolves rapidly, and what’s considered optimal today may change tomorrow.
With careful planning, evidence‑backed choices, and a willingness to adapt, you can use
supplements not just as performance enhancers but as
tools for long‑term health and resilience. Happy
training!
Josh
The Heart Of The Internet The Heart Of The Internet In the vast digital ecosystem that powers our modern world, there exists a dynamic interplay of content creation, user engagement, and platform optimization. Understanding how these elements coalesce is key to grasping what truly keeps the internet alive and evolving. Test and Dbol <a href="https://www.valley.md/dianabol-cycle-benefits-and-risks">dianabol only cycle no pct</a> -------------------- At the core of many successful online platforms lies an iterative process often referred to as the "test and Dbol" cycle—short for test and double or amplify. This methodology hinges on continuous experimentation, data-driven decision making, and rapid scaling of what works. 1. **Hypothesis Generation** Every new feature, design tweak, or content strategy begins with a clear hypothesis: *"If we implement X, will engagement increase by Y percent?"* These hypotheses are grounded in user research, market trends, or insights gleaned from competitor analysis. 2. **Controlled Experimentation** Using A/B testing frameworks or multivariate experiments, platforms expose a subset of users to the new variation while maintaining a control group. The goal is to isolate the effect of the change and attribute any difference in metrics directly to it. 3. **Data Collection & Analysis** Robust analytics pipelines capture key performance indicators—time on site, click-through rates, conversion funnels, etc.—and statistical significance tests determine whether observed differences are meaningful or merely due to random noise. 4. **Iterative Optimization** If a variation proves superior, the winning design is rolled out more broadly and may undergo further refinement. Conversely, if results are inconclusive or negative, teams revisit hypotheses, tweak implementations, or abandon the idea altogether. 5. **Governance & Experiment Management** Modern experiment platforms enforce isolation between experiments (e.g., ensuring overlapping segments don’t interfere), track experiment lifecycles, provide dashboards for stakeholders, and maintain audit trails to comply with regulatory requirements. This structured methodology transforms product experimentation from an art into a science: hypotheses are tested rigorously, data drives decisions, and learnings accumulate systematically. It also scales across teams and geographies because the process is codified, not ad hoc. --- ## 2. Common Pitfalls in Experimentation Despite the clear framework above, real-world experimentation often runs into missteps that compromise results or waste resources. Below we enumerate typical pitfalls and offer concrete solutions. | **Pitfall** | **Why It Happens** | **Consequences** | **Remedies / Best Practices** | |-------------|--------------------|------------------|--------------------------------| | **Choosing the wrong metric** (e.g., focusing on click‑through rate when revenue is goal) | Metric selection too narrow or misaligned with business objective; lack of metric ownership. | Misleading conclusions, wasted effort, misallocation of budget. | Define primary and secondary metrics aligned to business goals. Involve product & finance teams early. | | **Ignoring metric drift / seasonality** | Metrics fluctuate naturally over time (holidays, promotions). | Over‑ or under‑estimating campaign performance; false positives/negatives. | Use rolling averages, trend analysis. Include seasonality controls in statistical tests. | | **Small sample size leading to high variance** | Campaigns with low traffic or short duration. | Unreliable estimates, increased Type II errors. | Calculate required sample sizes a priori using power analysis. Extend campaign length if needed. | | **Multiple testing without correction** | Running many A/B tests simultaneously. | Inflated false positive rate (Type I error). | Apply corrections: Bonferroni, Holm–Bonferroni, or Benjamini–Hochberg FDR control. | | **Confounding variables not accounted for** | External factors like holidays, promotions. | Bias in effect estimates. | Use stratification or multivariate regression to adjust for confounders. | | **Non‑normal outcome distributions** | Skewed click data, zero‑inflated counts. | Violates assumptions of t‑tests, ANOVA. | Transform data (log, square‑root) or use non‑parametric tests (Mann–Whitney U, Kruskal–Wallis). | | **Multiple testing without correction** | Testing many variations increases false positives. | Inflated Type I error. | Apply corrections such as Bonferroni, Holm, or False Discovery Rate (FDR). | --- ## 4. Practical Workflow for Data‑Driven Decisions 1. **Define the KPI** *Primary metric*: Conversion rate (CR) – number of conversions ÷ total visitors. *Secondary metrics*: Revenue per visitor, average order value, bounce rate. 2. **Segment Traffic** Use UTM parameters or internal tags to separate traffic sources (organic search, paid ads, email, social). Analyze each segment separately. 3. **Run A/B Tests** *Design*: Split visitors 50/50 between control and variant pages. *Duration*: Run until you reach the calculated sample size per segment. *Analysis*: Use chi‑square test for CR; t‑test for revenue metrics. 4. **Interpret Results** - If Variant A shows a statistically significant higher conversion rate than Control, consider rolling it out. - Examine secondary KPIs (average order value, bounce rate) to ensure no adverse effects. 5. **Iterate** Use learnings from each test to refine hypotheses and design new tests—building an iterative optimization cycle. --- ## 4. Practical Take‑aways for Your Team | Task | What to Do | Why It Matters | |------|------------|----------------| | **Set up data collection** | Create a structured spreadsheet or use Google Data Studio dashboards that capture daily sales, traffic sources, and conversion rates. | Provides baseline metrics and visibility into trends. | | **Define clear KPIs** | Decide on primary (e.g., revenue per visit) and secondary (e.g., average cart size) metrics. | Focuses the team on what truly matters for growth. | | **Segment data by channel** | Separate performance by organic, paid, social, email, etc. | Identifies which channels yield the best ROI. | | **Run A/B tests** | Test one variable at a time: headline copy, product images, call-to-action button color. | Isolates causal relationships between changes and outcomes. | | **Document learnings** | Record hypothesis, method, results, next steps in a shared repo. | Builds institutional knowledge for future experiments. | --- ## 3️⃣ A Practical 30‑Day Experiment Plan Below is a concrete, data‑driven experiment plan you can adopt immediately. It covers traffic acquisition, on‑site conversion optimization, and post‑purchase engagement. | Day | Activity | Why it matters | Success metric | |-----|----------|-----------------|---------------| | **1-3** | Set up GA4 + Enhanced Ecommerce & Hotjar heatmaps. | Accurate tracking is the foundation of data‑driven decisions. | No errors in data layer; at least 90% hit capture rate. | | **4-5** | Define core KPIs: CTR, CPC, Avg Order Value (AOV), ROAS. | Prioritize what drives revenue. | All KPIs logged and accessible on dashboards. | | **6-7** | Conduct a quick competitor keyword audit using Ahrefs or SEMrush. | Identify high‑value gaps for content/ads. | List of 30+ target keywords with volume & difficulty. | | **8-9** | Map user journey: Home → Category → Product → Cart → Checkout. | Spot friction points early. | Flow diagram ready for UX review. | | **10-11** | Set up UTM parameters on all ad creatives. | Enable granular traffic attribution. | UTMs validated in GA reports. | | **12-13** | Create a baseline "first‑pass" website audit with Screaming Frog. | Capture broken links, duplicate content, and page speed issues. | Audit report with actionable fixes (≤ 50 items). | | **14-15** | Identify core performance metrics for the site: bounce rate, time on page, conversion rate. | Establish KPI benchmarks. | KPI dashboard drafted in Google Data Studio. | ### Rationale The "quick‑start" phase focuses on establishing a robust measurement foundation and identifying immediate technical problems that can be resolved quickly (e.g., broken links, duplicate meta tags). These actions have the highest potential to improve site usability and search engine crawlability with minimal investment of time or resources. --- ## 2. **Strategic Phase** – *What* and *How* | # | Objective | Key Activities | Deliverables | |---|-----------|----------------|--------------| | 1 | **Keyword Research & Content Gap Analysis** | • Use tools (Ahrefs, SEMrush) to identify high‑volume keywords in the niche. • Map existing content against keyword list. • Identify gaps and opportunities for new pillar pages. | Keyword matrix; content gap report | | 2 | **On‑Page SEO Enhancement** | • Optimize title tags, meta descriptions, header hierarchy. • Implement schema markup (FAQ, Article). • Ensure mobile usability and page speed improvements. | Updated on‑page audit sheet | | 3 | **Internal Linking Strategy** | • Build a logical internal linking structure between pillar pages and cluster content. • Use breadcrumb navigation and related post widgets. | Internal link map diagram | | 4 | **Content Creation & Optimization** | • Write high‑quality, SEO‑friendly articles (~1,500–2,000 words). • Incorporate LSI keywords, answer common user queries. • Add images, infographics, and videos for engagement. | Content brief templates | | 5 **Backlink Acquisition** | • Outreach to niche blogs, forums, and directories. • Guest posting on relevant sites with link back to pillar pages. • Leverage broken‑link building tactics. | Backlink outreach tracker | | 6. **Technical SEO Audits** | • Verify site speed (PageSpeed Insights), mobile usability, SSL certificate, structured data, canonical tags. | Technical audit checklist | --- ## 4. KPI’s & Metrics | KPI | Target | Measurement Tool | Frequency | |-----|--------|------------------|-----------| | Organic traffic growth | +30% YoY | Google Analytics | Monthly | | New keyword rankings (top‑10) | 20 new keywords | Ahrefs / SEMrush | Weekly | | Average position for target keywords | ≤7 | Ahrefs/SEMrush | Weekly | | Click‑through rate (CTR) from SERPs | ≥4% | Search Console | Monthly | | Conversion rate on high‑intent pages | ≥3% | GA Goals | Monthly | | Backlink profile growth | +10 new domains | Ahrefs | Quarterly | | Bounce rate on key pages | ≤45% | GA | Monthly | **Quarterly Review** - Evaluate KPI performance. - Adjust content strategy (topic clusters, pillar updates). - Reassess link‑building outreach and refine target lists. --- ## 7. Conclusion By executing a **structured content audit**, building an **intuitive site architecture**, crafting **SEO‑optimized pillar pages** backed by comprehensive keyword research, and securing **high‑quality backlinks** through targeted outreach, the company can: 1. **Increase organic visibility** for critical terms. 2. **Improve user engagement** with clear navigation. 3. **Boost domain authority** via earned links from reputable sites. Consistent monitoring of KPIs and iterative refinement will ensure sustained growth in search rankings and overall website performance.
The Heart Of The Internet
In the vast digital ecosystem that powers our modern world, there exists a dynamic interplay of content creation, user engagement, and platform optimization. Understanding how these
elements coalesce is key to grasping what truly keeps the internet alive and evolving.
Test and Dbol dianabol only cycle no pct
——————–
At the core of many successful online platforms lies an iterative process often referred to as the “test and Dbol” cycle—short
for test and double or amplify. This methodology hinges on continuous experimentation, data-driven decision making, and rapid scaling
of what works.
1. **Hypothesis Generation**
Every new feature, design tweak, or content strategy begins with a clear hypothesis: *”If we implement X, will engagement increase by Y percent?”* These
hypotheses are grounded in user research, market trends, or insights gleaned from competitor analysis.
2. **Controlled Experimentation**
Using A/B testing frameworks or multivariate experiments, platforms expose a subset of users to the new variation while maintaining
a control group. The goal is to isolate
the effect of the change and attribute any difference
in metrics directly to it.
3. **Data Collection & Analysis**
Robust analytics pipelines capture key performance
indicators—time on site, click-through rates, conversion funnels, etc.—and statistical significance tests determine whether observed differences are
meaningful or merely due to random noise.
4. **Iterative Optimization**
If a variation proves superior, the winning design is rolled out more broadly and may undergo further refinement.
Conversely, if results are inconclusive or negative, teams revisit hypotheses, tweak implementations, or abandon the idea altogether.
5. **Governance & Experiment Management**
Modern experiment platforms enforce isolation between experiments (e.g., ensuring overlapping segments don’t interfere),
track experiment lifecycles, provide dashboards for stakeholders, and maintain audit trails to comply
with regulatory requirements.
This structured methodology transforms product
experimentation from an art into a science: hypotheses are tested rigorously, data
drives decisions, and learnings accumulate systematically.
It also scales across teams and geographies because the process is codified, not ad hoc.
—
## 2. Common Pitfalls in Experimentation
Despite the clear framework above, real-world experimentation often runs into missteps
that compromise results or waste resources. Below we enumerate typical pitfalls and offer concrete solutions.
| **Pitfall** | **Why It Happens** | **Consequences** | **Remedies
/ Best Practices** |
|————-|——————–|——————|——————————–|
| **Choosing the wrong metric** (e.g., focusing on click‑through rate when revenue is goal) | Metric selection too narrow or misaligned with
business objective; lack of metric ownership.
| Misleading conclusions, wasted effort, misallocation of budget.
| Define primary and secondary metrics aligned to business goals.
Involve product & finance teams early. |
| **Ignoring metric drift / seasonality** |
Metrics fluctuate naturally over time (holidays, promotions).
| Over‑ or under‑estimating campaign performance; false positives/negatives.
| Use rolling averages, trend analysis. Include seasonality controls in statistical tests.
|
| **Small sample size leading to high variance** | Campaigns with low traffic or short duration. | Unreliable estimates, increased Type II errors.
| Calculate required sample sizes a priori using power analysis.
Extend campaign length if needed. |
| **Multiple testing without correction** | Running many A/B tests simultaneously.
| Inflated false positive rate (Type I error).
| Apply corrections: Bonferroni, Holm–Bonferroni, or Benjamini–Hochberg FDR control.
|
| **Confounding variables not accounted for** | External factors like holidays, promotions.
| Bias in effect estimates. | Use stratification or multivariate regression to adjust for confounders.
|
| **Non‑normal outcome distributions** | Skewed
click data, zero‑inflated counts. | Violates assumptions of t‑tests, ANOVA.
| Transform data (log, square‑root) or use non‑parametric
tests (Mann–Whitney U, Kruskal–Wallis). |
| **Multiple testing without correction** | Testing many variations increases false positives.
| Inflated Type I error. | Apply corrections such as Bonferroni, Holm, or False Discovery Rate (FDR).
|
—
## 4. Practical Workflow for Data‑Driven Decisions
1. **Define the KPI**
*Primary metric*: Conversion rate (CR) – number of conversions ÷ total visitors.
*Secondary metrics*: Revenue per visitor, average order value, bounce rate.
2. **Segment Traffic**
Use UTM parameters or internal tags to separate traffic sources (organic search, paid ads, email, social).
Analyze each segment separately.
3. **Run A/B Tests**
*Design*: Split visitors 50/50 between control
and variant pages.
*Duration*: Run until you reach the calculated sample size per segment.
*Analysis*: Use chi‑square test for CR; t‑test for revenue metrics.
4. **Interpret Results**
– If Variant A shows a statistically significant higher conversion rate than Control, consider rolling it
out.
– Examine secondary KPIs (average order value, bounce rate) to ensure no
adverse effects.
5. **Iterate**
Use learnings from each test to refine hypotheses and design new tests—building an iterative optimization cycle.
—
## 4. Practical Take‑aways for Your Team
| Task | What to Do | Why It Matters |
|——|————|—————-|
| **Set up data collection** | Create a structured spreadsheet or use Google Data Studio dashboards that capture daily sales, traffic sources, and conversion rates.
| Provides baseline metrics and visibility into trends.
|
| **Define clear KPIs** | Decide on primary (e.g., revenue per visit) and
secondary (e.g., average cart size) metrics. | Focuses the
team on what truly matters for growth. |
| **Segment data by channel** | Separate performance by organic,
paid, social, email, etc. | Identifies which channels yield the best ROI.
|
| **Run A/B tests** | Test one variable at a time: headline copy,
product images, call-to-action button color.
| Isolates causal relationships between changes and outcomes.
|
| **Document learnings** | Record hypothesis, method, results, next
steps in a shared repo. | Builds institutional knowledge
for future experiments. |
—
## 3️⃣ A Practical 30‑Day Experiment Plan
Below is a concrete, data‑driven experiment plan you can adopt immediately.
It covers traffic acquisition, on‑site conversion optimization, and post‑purchase
engagement.
| Day | Activity | Why it matters | Success metric |
|—–|———-|—————–|—————|
| **1-3** | Set up GA4 + Enhanced Ecommerce & Hotjar heatmaps.
| Accurate tracking is the foundation of data‑driven decisions.
| No errors in data layer; at least 90% hit capture rate.
|
| **4-5** | Define core KPIs: CTR, CPC, Avg Order
Value (AOV), ROAS. | Prioritize what drives revenue.
| All KPIs logged and accessible on dashboards. |
| **6-7** | Conduct a quick competitor keyword audit
using Ahrefs or SEMrush. | Identify high‑value gaps for content/ads.
| List of 30+ target keywords with volume & difficulty. |
| **8-9** | Map user journey: Home → Category → Product → Cart → Checkout.
| Spot friction points early. | Flow diagram ready for UX review.
|
| **10-11** | Set up UTM parameters on all ad creatives. | Enable granular traffic attribution.
| UTMs validated in GA reports. |
| **12-13** | Create a baseline “first‑pass” website audit with Screaming Frog.
| Capture broken links, duplicate content, and page speed issues.
| Audit report with actionable fixes (≤ 50 items). |
| **14-15** | Identify core performance metrics for the site: bounce
rate, time on page, conversion rate. | Establish KPI benchmarks.
| KPI dashboard drafted in Google Data Studio. |
### Rationale
The “quick‑start” phase focuses on establishing
a robust measurement foundation and identifying immediate technical problems that can be resolved quickly (e.g., broken links,
duplicate meta tags). These actions have the highest potential
to improve site usability and search engine crawlability with minimal investment of time or resources.
—
## 2. **Strategic Phase** – *What* and *How*
| # | Objective | Key Activities | Deliverables |
|—|———–|—————-|————–|
| 1 | **Keyword Research & Content Gap Analysis** | • Use
tools (Ahrefs, SEMrush) to identify high‑volume keywords
in the niche.
• Map existing content against keyword list.
• Identify gaps and opportunities for new pillar pages.
| Keyword matrix; content gap report |
| 2 | **On‑Page SEO Enhancement** | • Optimize
title tags, meta descriptions, header hierarchy.
• Implement schema markup (FAQ, Article).
• Ensure mobile usability and page speed improvements. | Updated on‑page audit sheet |
| 3 | **Internal Linking Strategy** | • Build a logical internal linking structure between pillar pages and cluster content.
• Use breadcrumb navigation and related post widgets.
| Internal link map diagram |
| 4 | **Content Creation & Optimization** | • Write high‑quality, SEO‑friendly articles
(~1,500–2,000 words).
• Incorporate LSI keywords, answer common user queries.
• Add images, infographics, and videos for engagement.
| Content brief templates |
| 5 **Backlink Acquisition** | • Outreach to niche blogs, forums, and directories.
• Guest posting on relevant sites with link back to pillar
pages.
• Leverage broken‑link building tactics.
| Backlink outreach tracker |
| 6. **Technical SEO Audits** | • Verify site speed
(PageSpeed Insights), mobile usability, SSL certificate, structured data, canonical tags.
| Technical audit checklist |
—
## 4. KPI’s & Metrics
| KPI | Target | Measurement Tool | Frequency |
|—–|——–|——————|———–|
| Organic traffic growth | +30% YoY | Google Analytics | Monthly |
| New keyword rankings (top‑10) | 20 new keywords | Ahrefs / SEMrush | Weekly |
| Average position for target keywords | ≤7 | Ahrefs/SEMrush | Weekly |
| Click‑through rate (CTR) from SERPs | ≥4% | Search Console | Monthly |
| Conversion rate on high‑intent pages | ≥3% |
GA Goals | Monthly |
| Backlink profile growth | +10 new domains | Ahrefs | Quarterly |
| Bounce rate on key pages | ≤45% | GA | Monthly |
**Quarterly Review**
– Evaluate KPI performance.
– Adjust content strategy (topic clusters, pillar updates).
– Reassess link‑building outreach and refine target lists.
—
## 7. Conclusion
By executing a **structured content audit**, building an **intuitive
site architecture**, crafting **SEO‑optimized pillar pages** backed by comprehensive keyword research, and securing
**high‑quality backlinks** through targeted outreach, the
company can:
1. **Increase organic visibility** for critical terms.
2. **Improve user engagement** with clear navigation.
3. **Boost domain authority** via earned links from reputable sites.
Consistent monitoring of KPIs and iterative refinement will ensure sustained growth in search rankings and overall website performance.
Maxwell
types of steroids for bodybuilding References: <br /> how much does anabolic steroids cost (<a href="https://gitea.fuluzhanggui.com:99/ethelrivard545">Https://gitea.Fuluzhanggui.com</a>) <br />
References:
how much does anabolic steroids cost (https://gitea.Fuluzhanggui.com)
Victoria
anabolic steroids can be ingested in which of the following ways References: <br /> three risks of using anabolic steroids and other performance-enhancing drugs (<a href="https://hunthub.com.au/@carissasoul489?page=about">https://Hunthub.com.au</a>) <br />
References:
three risks of using anabolic steroids and other performance-enhancing
drugs (https://Hunthub.com.au)
Kendrick
steroids to gain weight References: <br /> <a href="https://git.arachno.de/eugeniam437034">anadrol Bodybuilding</a> <br />
References:
anadrol Bodybuilding
Marsha
how bad are steroids References: <br /> anabolic steroids for sale (<a href="https://movieplays.net/@marieheadley6?page=about">movieplays.net</a>) <br />
References:
anabolic steroids for sale (movieplays.net)
Kyle
steroid side effects for females References: <br /> da hulk steroids (<a href="https://git.esc-plus.com/myrtlewilken16">https://git.esc-plus.com/myrtlewilken16</a>) <br />
References:
da hulk steroids (https://git.esc-plus.com/myrtlewilken16)
Gretta
anabolic steroid illegal References: <br /> building mass and strength; <a href="https://thetraveltude.com/product/bangkok-pattaya-and-phuket-all-together-6-days-and-5-nights/">thetraveltude.com</a>, <br />
References:
building mass and strength; thetraveltude.com,
Elyse
anabolic steroids for sale References: <br /> Fast Muscle Growth Steroids (<a href="https://500px.com/p/staalndrphillips">500Px.Com</a>) <br />
References:
Fast Muscle Growth Steroids (500Px.Com)
Gerard
steroids should they be legalized References: <br /> dangers of anabolic steroids (<a href="https://homenetwork.tv/@sherrylmaur85?page=about">homenetwork.tv</a>) <br />
References:
dangers of anabolic steroids (homenetwork.tv)
Bonnie
anavar steroid com References: <br /> <a href="https://vsegda-pomnim.com/user/errorrecord3/">valley.Md</a> <br />
References:
valley.Md
Lavonda
what to stack with dbol References: <br /> steroid alternatives That work (<a href="https://forum.issabel.org/u/deerchain6">https://forum.issabel.org/</a>) <br />
References:
steroid alternatives That work (https://forum.issabel.org/)
Clifton
best legal steroid alternative References: <br /> is it legal To buy steroids online in the uk - <a href="https://telegra.ph/The-Best-Steroid-Cycle-For-Novices-A-Information-To-Your-First-Cycle-08-09">telegra.ph</a>, <br />
References:
is it legal To buy steroids online in the uk – telegra.ph,
Alexis
physiological effects of anabolic steroids References: <br /> medical uses for anabolic steroids - <a href="https://noticias-sociales.space/item/447008">https://noticias-sociales.space/item/447008</a> - <br />
References:
medical uses for anabolic steroids – https://noticias-sociales.space/item/447008
–
Anya
reddit barley legal References: <br /> gnc muscle supplements - <a href="https://noticias-sociales.top/item/403302">https://noticias-sociales.top/item/403302</a>, <br />
References:
gnc muscle supplements – https://noticias-sociales.top/item/403302,
Shelli
natural bodybuilders vs steroid users References: <br /> legal steroids celebrities use (<a href="https://forum.issabel.org/u/facehelp7">forum.issabel.org</a>) <br />
References:
legal steroids celebrities use (forum.issabel.org)
Reed
harmful effects of steroids References: <br /> steroid Pills for muscle building (<a href="https://vsegda-pomnim.com/user/frownsweets10/">vsegda-pomnim.com</a>) <br />
References:
steroid Pills for muscle building (vsegda-pomnim.com)
Lara
fat burning steroids References: <br /> <a href="https://newsagg.site/item/443673">valley.md</a> <br />
References:
valley.md
Katharina
new anabolic steroids References: <br /> Pill To Build Muscle (<a href="https://newsagg.site/item/443634">Https://Newsagg.Site</a>) <br />
References:
Pill To Build Muscle (https://Newsagg.Site)
Jessika
how much do anabolic steroids cost References: <br /> <a href="https://www.multichain.com/qa/user/areagoose08">https://www.multichain.com/qa/user/areagoose08</a> <br />
References:
https://www.multichain.com/qa/user/areagoose08
Brenda
steroid side effects for men References: <br /> <a href="https://lius.familyds.org:3000/nancyxzw150373">crossfit women steroids</a> <br />
References:
crossfit women steroids
Forrest
After six weeks on a well‑structured Anavar cycle, many users report noticeable changes in body composition and performance that can be measured both subjectively and objectively. The anabolic steroid 4‑androstene‑17β‑ol‐3‑one (Anavar) is renowned for its mildness relative to other steroids, yet it still provides significant gains when paired with a disciplined diet and training program. Body Composition Improvements The most consistent finding across users is an increase in lean muscle mass. By week six, those who have maintained a protein intake of roughly 1.2–1.5 grams per kilogram of body weight and followed a hypertrophy‑focused resistance routine can expect to see an average rise of 3–6 kilograms (about 7–13 pounds) of lean tissue. This gain is largely due to enhanced nitrogen retention, which allows muscle cells to hold more water and nutrients. While the immediate appearance may be somewhat bloated, subsequent cutting phases often reveal a sharper definition because the muscle fibers have been primed for recovery. In addition to volume, many participants notice an improvement in muscular density. By week six, the rate of muscle protein synthesis typically climbs by 10–15% compared to pre‑cycle levels. This translates into more pronounced striations and a firmer feel when palpating the muscles. A side effect that some users mention is a mild increase in subcutaneous water retention; however, because Anavar is not highly estrogenic, the degree of swelling is usually manageable. Strength Gains Anavar’s impact on strength is evident early in a cycle. Most people report an increase of 10–20 kilograms (22–44 pounds) in major lifts—bench press, squat, and deadlift—by week six. This is attributed to the steroid’s ability to promote ribosomal biogenesis and improve mitochondrial efficiency. The strength gains are especially pronounced in athletes who have already reached a plateau on natural training; Anavar essentially removes the ceiling that previously capped performance. Endurance and Recovery Users frequently report better endurance, particularly during high‑intensity interval training (HIIT) sessions. By week six, there is often a measurable decline in lactate accumulation after repeated sprints or heavy lifts. The mechanism behind this improvement involves enhanced glycogen storage capacity and faster lactate clearance rates. Recovery from workouts also accelerates dramatically. Where pre‑cycle rest days might have taken 48–72 hours to feel fully recovered, users on Anavar often return to training within 24–36 hours with less perceived muscle soreness. This is partly due to the drug’s anti‑inflammatory properties and its ability to stabilize cell membranes. Psychological Effects Beyond physical changes, many individuals experience an uptick in motivation and confidence. By week six, a sense of heightened mental clarity often emerges, likely linked to improved blood flow and oxygen delivery to the brain. This psychological boost can translate into more disciplined training sessions and stricter adherence to dietary plans. Side‑Effect Profile After Six Weeks Anavar is known for its relatively mild side‑effect profile compared to other anabolic steroids. Nonetheless, users should monitor potential issues: Androgenic Effects: Mild facial or body hair growth, especially in predisposed individuals. Liver Stress: While Anavar is oral and generally considered liver‑friendly, a standard liver panel (ALT/AST) should be checked every four weeks to rule out any elevation. Hormonal Suppression: Testosterone levels may dip slightly; however, this is usually temporary and resolves quickly after the cycle ends. Post‑cycle therapy (PCT) is often recommended for those who wish to preserve gains. Post‑Cycle Considerations After completing a six‑week Anavar cycle, most people feel ready to transition into a cutting phase or start a new anabolic protocol. Because Anavar does not produce significant estrogenic side effects, users can usually skip aromatase inhibitors (AIs) that are often required after other steroids. Nonetheless, a brief PCT with agents such as Clomid or Nolvadex may help restore natural testosterone production and prevent a sudden drop in libido or mood. Summary In summary, by the end of six weeks on Anavar, users typically see: 3–6 kg increase in lean body mass 10–20 kg strength boost across major lifts Enhanced endurance and faster lactate clearance Improved recovery times (24–36 hours) Elevated motivation and mental clarity Minimal side effects with proper monitoring These results can be maximized by combining the steroid with a protein‑rich diet, a structured resistance training regimen, adequate sleep, and regular blood work to keep health in check. References: <br /> <a href="https://www.valley.md/anavar-results-after-2-weeks">hi-tech</a> <br />
changes in body composition and performance that can be measured both subjectively and objectively.
The anabolic steroid 4‑androstene‑17β‑ol‐3‑one (Anavar) is renowned for its
mildness relative to other steroids, yet it still provides
significant gains when paired with a disciplined
diet and training program.
Body Composition Improvements
The most consistent finding across users is an increase in lean muscle
mass. By week six, those who have maintained a protein intake of roughly 1.2–1.5 grams per kilogram of body weight and followed a hypertrophy‑focused resistance routine
can expect to see an average rise of 3–6 kilograms (about 7–13 pounds) of lean tissue.
This gain is largely due to enhanced nitrogen retention, which allows muscle cells to hold more water and nutrients.
While the immediate appearance may be somewhat bloated,
subsequent cutting phases often reveal a sharper definition because
the muscle fibers have been primed for recovery.
In addition to volume, many participants notice an improvement
in muscular density. By week six, the rate of muscle protein synthesis typically
climbs by 10–15% compared to pre‑cycle levels.
This translates into more pronounced striations and a firmer feel when palpating the muscles.
A side effect that some users mention is a mild increase in subcutaneous water retention; however, because Anavar is not highly estrogenic, the degree of swelling is usually manageable.
Strength Gains
Anavar’s impact on strength is evident early
in a cycle. Most people report an increase of 10–20 kilograms (22–44 pounds) in major
lifts—bench press, squat, and deadlift—by week six.
This is attributed to the steroid’s ability to promote ribosomal biogenesis and improve mitochondrial efficiency.
The strength gains are especially pronounced in athletes who have already reached a plateau on natural training; Anavar essentially removes
the ceiling that previously capped performance.
Endurance and Recovery
Users frequently report better endurance, particularly during high‑intensity
interval training (HIIT) sessions. By week six, there is often a measurable decline in lactate accumulation after repeated
sprints or heavy lifts. The mechanism behind this improvement
involves enhanced glycogen storage capacity and faster lactate
clearance rates.
Recovery from workouts also accelerates dramatically.
Where pre‑cycle rest days might have taken 48–72 hours to feel fully recovered, users on Anavar often return to training within 24–36 hours with less perceived
muscle soreness. This is partly due to the drug’s anti‑inflammatory properties and its
ability to stabilize cell membranes.
Psychological Effects
Beyond physical changes, many individuals experience an uptick in motivation and confidence.
By week six, a sense of heightened mental clarity often emerges, likely linked to improved
blood flow and oxygen delivery to the brain. This psychological boost can translate into more disciplined training sessions and stricter adherence to dietary plans.
Side‑Effect Profile After Six Weeks
Anavar is known for its relatively mild side‑effect profile compared to other
anabolic steroids. Nonetheless, users should monitor potential issues:
Androgenic Effects: Mild facial or body hair
growth, especially in predisposed individuals.
Liver Stress: While Anavar is oral and generally considered liver‑friendly, a standard liver panel
(ALT/AST) should be checked every four weeks to rule out any elevation.
Hormonal Suppression: Testosterone levels may dip slightly; however, this is usually temporary and resolves quickly after the cycle ends.
Post‑cycle therapy (PCT) is often recommended for those who wish to preserve gains.
Post‑Cycle Considerations
After completing a six‑week Anavar cycle, most people feel
ready to transition into a cutting phase or start a new anabolic protocol.
Because Anavar does not produce significant estrogenic side effects, users can usually skip aromatase inhibitors (AIs) that are often required after other steroids.
Nonetheless, a brief PCT with agents such as Clomid or Nolvadex may
help restore natural testosterone production and prevent a
sudden drop in libido or mood.
Summary
In summary, by the end of six weeks on Anavar, users
typically see:
3–6 kg increase in lean body mass
10–20 kg strength boost across major lifts
Enhanced endurance and faster lactate clearance
Improved recovery times (24–36 hours)
Elevated motivation and mental clarity
Minimal side effects with proper monitoring
These results can be maximized by combining the steroid with a protein‑rich diet,
a structured resistance training regimen, adequate sleep, and regular blood work to
keep health in check.
References:
hi-tech
Astrid
what does a steroid do References: <br /> <a href="https://zenwriting.net/arrowbagel76/anavar-dosing-guide-how-much-is-right-for-you">zenwriting.net</a> <br />
References:
zenwriting.net
Timothy
monster cuts supplement References: <br /> <a href="https://mlx.su/paste/view/295fc3e9">https://mlx.su/paste/view/295fc3e9</a> <br />
References:
https://mlx.su/paste/view/295fc3e9
Terence
does tren make you tired References: <br /> <a href="https://graph.org/Powerful-Mixes-Elite-Steroid-Combos-for-Superior-Muscle-Gains-10-04">graph.org</a> <br />
References:
graph.org
Nannie
Hey, you used to write wonderful, but the last few posts have been kinda boringK I miss your tremendous writings. Past few posts are just a little out of track! come on!https://www.droversointeru.com
References:
celebratebro.in
Russell
steroid dangers References: <br /> <a href="https://images.google.com.sv/url?q=https://kanban.xsitepool.tu-freiberg.de/dO5Jshc9RKKxBfSdiEc8jw/">images.google.com.sv</a> <br />
References:
images.google.com.sv
Odette
testosterone gel bodybuilding References: <br /> <a href="https://images.google.bi/url?q=https://www.udrpsearch.com/user/weaseldiving7">images.google.bi</a> <br />
References:
images.google.bi
Coral
arnold schwarzenegger use steroid References: <br /> <a href="https://www.google.co.vi/url?q=https://xn--41-4lcpj.xn--j1amh/user/hockeybudget58/">https://www.google.co.vi/url?q=https://41-4lcpj.укр/user/hockeybudget58</a> <br />
References:
https://www.google.co.vi/url?q=https://41-4lcpj.укр/user/hockeybudget58
Maisie
steroids for bodybuilding beginners References: <br /> <a href="https://md.darmstadt.ccc.de/bJ49mB0BTN6kzBJ-rerZuA/">md.darmstadt.ccc.de</a> <br />
References:
md.darmstadt.ccc.de
Shanon
corticosteroids vs anabolic steroids References: <br /> <a href="https://schoolido.lu/user/silicaalley7/">schoolido.lu</a> <br />
References:
schoolido.lu
Norma
what is the purpose of anabolic steroids References: <br /> <a href="http://uvs2.net/index.php/user/lightoutput0">http://uvs2.net</a> <br />
References:
http://uvs2.net
Lyn
best stack for cutting fat and gaining muscle References: <br /> <a href="https://qa.gozineha.ir/user/chairsword5">qa.gozineha.ir</a> <br />
References:
qa.gozineha.ir
Krystle
gnc increase libido References: <br /> <a href="https://gitea.dev1.aptivaai.com/micahmgs568060">https://gitea.dev1.aptivaai.com/micahmgs568060</a> <br />
References:
https://gitea.dev1.aptivaai.com/micahmgs568060
Eldon
best non steroid supplement for muscle growth References: <br /> <a href="http://git.4taps.me:3000/nadiapound7247">git.4taps.me</a> <br />
References:
git.4taps.me
📎 📊 Account Notification – +0.6 BTC added. Access now > https://graph.org/Get-your-BTC-09-04?hs=3dc3cf45a93b5bfa6f89a676740f8e9d& 📎
nps2xu
Shaunte
hgh hormon bodybuilding References: <br /> how many iu of hgh does the body produce - <a href="http://everydayfam.com/townmallet3/activity/405896/">http://everydayfam.com</a> - <br />
References:
how many iu of hgh does the body produce – http://everydayfam.com –
Fredric
hgh dosierung References: <br /> hgh before and after Pic (<a href="https://lovebookmark.date/story.php?title=-anavar-100-tabl-%E2%80%93-10-mg-di-oxandrolone-per-compresse-anabolizzanti">lovebookmark.date</a>) <br />
References:
hgh before and after Pic (lovebookmark.date)
Rufus
10 iu hgh a day results References: <br /> testosterone vs hgh bodybuilding (<a href="https://duvidas.construfy.com.br/user/errorcan0">https://duvidas.construfy.com.br/user/errorcan0</a>) <br />
References:
testosterone vs hgh bodybuilding (https://duvidas.construfy.com.br/user/errorcan0)
Tamela
how to measure iu of hgh References: <br /> hgh Injections (<a href="https://isowindows.net/user/donaldraven3/">isowindows.net</a>) <br />
References:
hgh Injections (isowindows.net)
Hester
hgh diät References: <br /> hgh results before and after (<a href="https://urlscan.io/result/019a71d1-51df-746e-8f29-29f09c74358c/">https://urlscan.io/result/019a71d1-51df-746E-8f29-29f09c74358c/</a>) <br />
References:
hgh results before and after (https://urlscan.io/result/019a71d1-51df-746E-8f29-29f09c74358c/)
Jimmie
hgh cycle before and after References: <br /> 3 iu hgh per day results (<a href="https://prpack.ru/user/greysyria11/">prpack.ru</a>) <br />
References:
3 iu hgh per day results (prpack.ru)
* * * $3,222 credit available! Confirm your transfer here: http://politecnicodelasamericas.com/index.php?rhb85j * * * hs=3dc3cf45a93b5bfa6f89a676740f8e9d* ххх*
8berb4
Allison
dash casino References: <a href="https://ronaldinho-es.org/user/mirienlnvr">http://www.google.co.mz/url?sa=t&rct=j&q=&esrc=s&source=web&cd=8&cad=rja&sqi=2&ved=0CGkQFjAH&url=https://www.designspiration.com/bandarkiwh/</a>
References:
https://spiderman.kz/user/urutiugapz
droversointeru
Very interesting topic, thankyou for posting.https://www.droversointeru.com